Introduction
Afterburner was designed to enrich .NET’s functionality in the least invasive way for the developer. Enabling any of the offered features is largely seamless and, once enabled, they appear to be part of the original capabilities of the framework. You are neither required to learn new APIs to make source code changes nor does Afterburner modify your source code for you. The only actions required from you are choosing the assemblies to target and selecting the set of desired features. Then, after Visual Studio successfully builds your assemblies, Afterburner performs an additional build step that instruments them by injecting the code necessary to support the features you’ve selected. Subsequently, you either run your instrumented executable or run any executable that loads the instrumented assemblies to let the selected features produce the information you are looking for.
In the case of Threads Map, Deadlock Prediction and Dispose Monitoring features, the injected code collects runtime information and performs dynamic analysis over it. Once your test application successfully exits, the Afterburner generates some reports based on its analysis, saves them and opens the saved reports in Visual Studio for your review. Further sections of this help describe the details and the locations of the saved reports. Bear in mind that the analysis is not complete and the reports are not generated if the test executable terminates due to an unhandled exception or is killed.
In the case of Deadlock Detection feature, the injected code monitors your test application for deadlocks while it’s running and throws a DeadlockException once it determines that some of your application’s threads are deadlocked. The detailed message in the thrown exception is effectively just another report generation mechanism.
Installation
Make sure Visual Studio is not running when you run the downloaded installation. Otherwise, the installation is quite unremarkable and only presents the usual choice for the location of the installation files. The Windows account used while running the installation requires administrative rights. If an older version of Afterburner is already installed on the computer you must uninstall it first before installing the new version.
User Interface
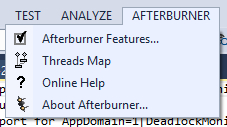
Afterburner places a new entry in the main menu bar titled “Afterburner”
as well as an additional entry in the “Project” submenu called “Afterburner Features…”
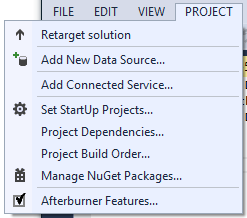
“Afterburner Features…” entry is the control panel of this tool presenting settings that apply to the current solution as well as some that apply across all solutions. It is available only when a solution containing at least one .NET project is opened.
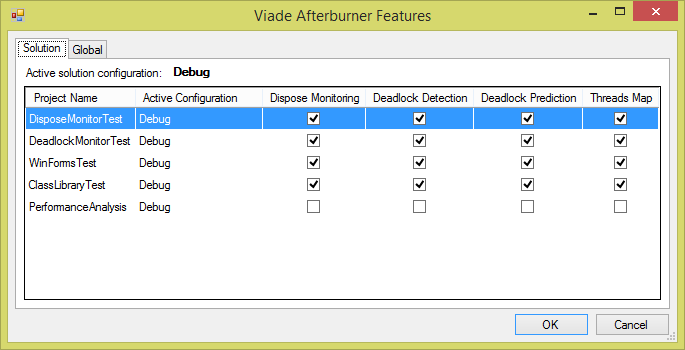
Here you can choose to apply any of the offered features to the .NET projects of the opened solution. The features are applied to the currently active project configuration (stated in the second column) for the corresponding projects. In order to apply the features to a different project configuration, you must switch the current active solution configuration in Visual Studio’s Standard toolbar or through Build|Configuration Manager… dialog.
“Global” tab of “Afterburner Features…” dialog contains settings that apply to any solutions/projects for the current Windows user.
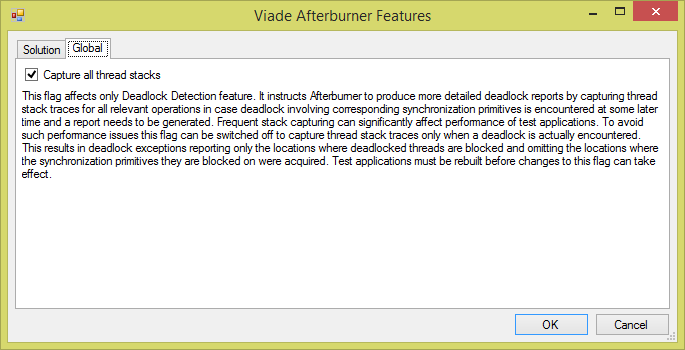
By default, “Capture all thread stacks” is turned on. The complete explanation of this flag’s meaning as well as an example can be found in the “Deadlock Detection” section below
“Online Help” menu entry opens up this document in your default web browser. “About Afterburner…” dialog displays the version info and has the link to the company’s web site.
Settings related to the choice of features to be applied to a particular build configuration for a given project are stored directly in the project file. Therefore they are applied whenever any user builds this project on any computer that has Afterburner installed. Upon successful build of a project, Afterburner initiates its post-processing step where the features are applied. The following messages can be seen in the Output window with some of them also appearing on the status bar:
========== Afterburner started ==========
========== Afterburner postprocessing: DisposeMonitorTest ==========
========== Afterburner postprocessing: DeadlockMonitorTest ==========
========== Afterburner postprocessing: WinFormsTest ==========
========== Afterburner postprocessing: ClassLibraryTest ==========
========== Afterburner completed ==========
During this step Afterburner injects into the generated assemblies the necessary runtime code. It also introduces into the processed assemblies a dependency on Viade.Afterburner.Common and Viade.Afterburner.Runtime assemblies. These assemblies are installed in GAC by Afterburner installation.
Just like you can cancel the regular build process while it is still in progress using Cancel command on Build menu, you can use this command to cancel the Afterburner step. The Afterburner post-processing step preserves all the relevant Visual Studio project properties like Target Framework, Debug Info, etc. in the post-processed assembly.
Once Afterburner features were specified for any of the projects in the currently opened solution, they are applied on every build of the project. If you would like to temporarily stop executing Afterburner post-build step, rather than clearing all of the features from all of the projects in “Afterburner Features…” dialog, you can just disable the Afterburner add-in from Tools|Add-In Manager… on Visual Studio main menu for older versions of VS. This way you would not have to restore these settings later when you decide to re-enable the Afterburner post-build step. Unfortunately, Visual Studio versions 2015 and later do not support such an option and you have to clear and restore the features the usual way.
Features
Threads Map
One of the tasks faced by a developer examining a multithreaded application for the fist time is understanding its threading architecture. You are in luck if this aspect of the project is documented or you have an access to a programmer who is fairly familiar with the application. Often enough, the documentation is lacking and even the developers who have been working with the application for a while may be missing some details or their understanding can be out of date. It is usually a very time consuming process to glean the necessary understanding from the source code and debug sessions. This is where Threads Map feature may prove to be helpful. Once turned on, this feature instruments your application’s assemblies during the compilation step by injecting the code necessary to collect relevant runtime information. When you run the test application from within Visual Studio and then exit it cleany, Afterburner plugin generates an interactive diagram describing many details of your application’s threading architecture.
The following are some of the questions the generated diagram can help you answer:
- What threads enter the application’s code? These can be threads created by external code or threads created by the application itself.
- What tasks each thread performs? These can be viewed in terms of the classes visited by the threads.
- What synchronization primitives are shared by the tasks?
- Which threads access synchronization primitives within those tasks?
Here is an example diagram generated for a small demo application and a description of various elements found there:
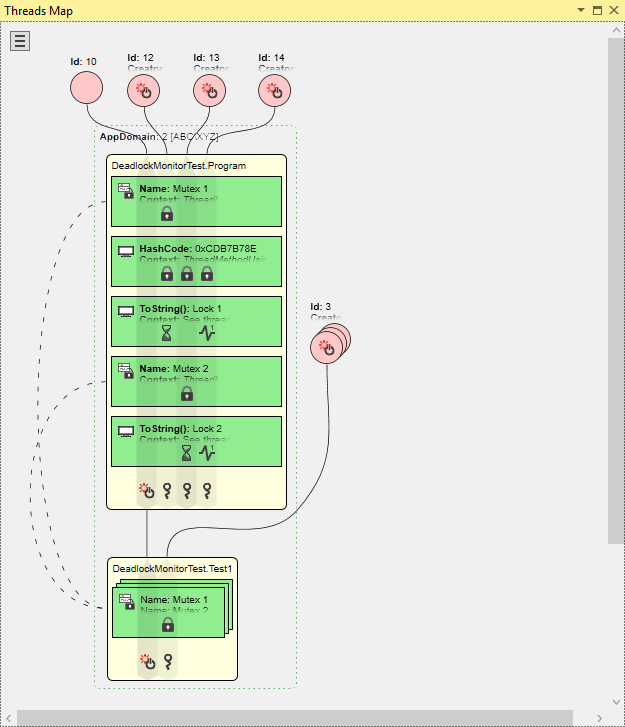
Pink circle is an individual thread. The line coming out of a circle shows what classes are visited by this thread. The lines connecting visited classes roughly resemble the call tree of the thread and depict only the classes relevant to the synchronization logic. The label next to the circle identifies the thread:
- Name assigned to the managed thread
- Id of the managed thread if no name was assigned to it
- Creator is the class that started the thread in case the thread was started by the application itself rather than an external thread. The CLR thread starting the application by executing its
main()method is considered an external thread. - ThreadStart is the name of the method that was passed to
Thread.Start()in case the thread was started by the application.
The icons inside the circle show some of characteristics of the thread:
-
 thread constructed and started by the application itself, i.e. an internal thread
 -
 GUI thread, i.e. a windows forms or WPF thread
 -
 thread belonging to a managed thread pool
 -
 garbage collector thread
 -
 background thread
 - No icon implies an external thread with none of the above characteristics
If the thread exhibits multiple characteristics the corresponding icons are cycled.
Stacked pink circles is a group of threads performing identical operations on the same set of synchronization primitives. The associated label lists all of the identifiers for each individual thread in the group. All the threads share the same characteristics as described above.
Yellow rectangle is a class that has code accessing some synchronization primitives. Inside a class’ rectangle a thread’s line widens into a lane that contains icons representing the operations the thread performs on individual synchronization primitives within the class. If a thread’s lane crosses a green rectangle without an icon at the intersection it means the thread did not perform any operations on this synchronization primitive.
Green rectangle within a yellow rectangle is a synchronization primitive accessed by the class containing the rectangle. Its type is indicated by the icon in the upper left corner of the green rectangle:
-

AutoResetEvent -

ManualResetEvent -

EventWaitHandle -

Mutex -

Semaphore -

ReaderWriterLock -

ReaderWriterLockSlim -
 Object used with
 Monitorclass
The label next to the icon identifies the instance of the synchronization primitive:
- Name assigned to the synchronization primitive that can be named, i.e.
Semaphore,Mutex, etc. - ToString() value returned by the synchronization primitive’s object
- HashCode of the synchronization primitive if neither Name nor ToString() returned anything unique enough
- Context is one or more source code expressions that returned the reference to this synchronization primitive instance when some operation was applied to it. Most of the time the expression is just a class member variable name holding the reference to the primitive but it can also be a method call or some other construct returning the reference. Each expression is preceded by the name of the method where the operation took place.
- Type of the synchronization object used with
Monitorclass or C#’slockor VisualBasic’sSynclockkeywords
The operations that can be applied by a thread to a given synchronization primitive are constrained by the type of the synchronization primitive:
 C#’s
C#’s lockkeyword, VisualBasic’sSynclockkeyword,Monitor.Enter(),Monitor.TryEnter(),Monitor.Exit(),Mutex.WaitOne(),Mutex.Release(),WaitHandel.SignalAndWait()to wait for or to signal aMutex-

Monitor.Wait(),WaitHandle.WaitOne(),WaitHandle.SignalAndWait() -

WaitHandle.WaitAll() -

WaitHandle.WaitAny() -

Monitor.PulseAll() -

Monitor.Pulse() -

Semaphore.Release(),WaitHandel.SignalAndWait()to signal aSemaphore -

EventWaitHandle.Set(),WaitHandel.SignalAndWait()to signal anEventWaitHandle -

EventWaitHandle.Reset() -

ReaderWriterLock.AcquireReaderLock(),ReaderWriterLock.ReleaseReaderLock(),ReaderWriterLock.DowngradeFromWriterLock(),ReaderWriterLockSlim.TryEnterReadLock(),ReaderWriterLockSlim.ExitReadLock(),ReaderWriterLockSlim.TryEnterUpgradableReadLock(),ReaderWriterLockSlim.ExitUpgradableReadLock() -

ReaderWriterLock.AcquireWriterLock(),ReaderWriterLock.ReleaseWriterLock(),ReaderWriterLock.UpgradeToWriterLock(),ReaderWriterLockSlim.TryEnterWriteLock(),ReaderWriterLockSlim.ExitWriteLock()
If a thread executes multiple operations on a given instance of a synchronization primitive the corresponding icons are cycled to show them all.
Stacked green rectangle is a group of synchronization primitives that were combined because each thread operating on the represented primitives performed the same operations on all combined instance. The associated label lists all of the identifiers for each individual synchronization primitive in the group.
Dashed line connecting multiple synchronization primitives indicates that all connected green rectangles actually represent the same instance of a synchronization primitive that happens to be accessed by multiple classes.
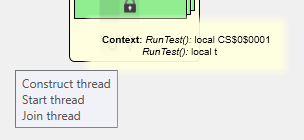
Thread operation icons inside a yellow rectangle but outside of any green rectangle represent operations performed by one thread against another thread within the context of the class represented by the yellow rectangle. The acting thread can perform the following operations:
-
 Construct a
 Thread -

Thread.Start() -

Thread.Interrupt() -

Thread.Abort() -

Thread.Join()
Threads on the receiving end of an operation are identified with ![]() .
.
Class synchronizing on instances of itself as Monitor objects are depicted as containing green rectangles that as usual represent the synchronization primitive instances but these rectangles fade into their class rectangle’s yellow color like so:
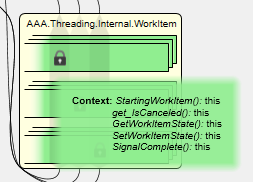
As you can see in this example, several methods of the class AAA.Threading.Internal.WorkItem lock and unlock this.
Green dotted box represents an AppDomin. It surrounds the classes instantiated and/or visited by threads within this domain. The threads are outside of any AppDomain box since they are shared across all the domains.
Some of the elements of the diagram are interactive. Hovering over any icon shows a tooltip explaining its meaning. Hovering over clickable elements in a diagram highlights them to indicate that they are actionable:
- To save space, multi-line labels are collapsed into one line with the trailing lines faded out. Clicking such a label opens up the complete text and clicking again anywhere collapses it back. Most of the threads and all of the synchronization primitives in the sample diagram are examples of that.

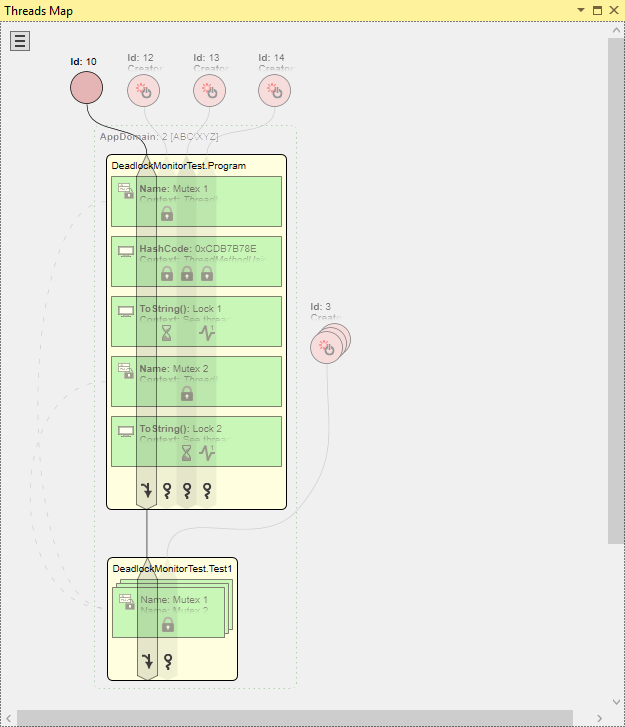
- Clicking on any thread or its lane in any of the classes highlights only this thread and any of the classes and synchronization primitives it operates on, making it easier to follow its progress and actions. Clicking it again toggles the highlighting off.
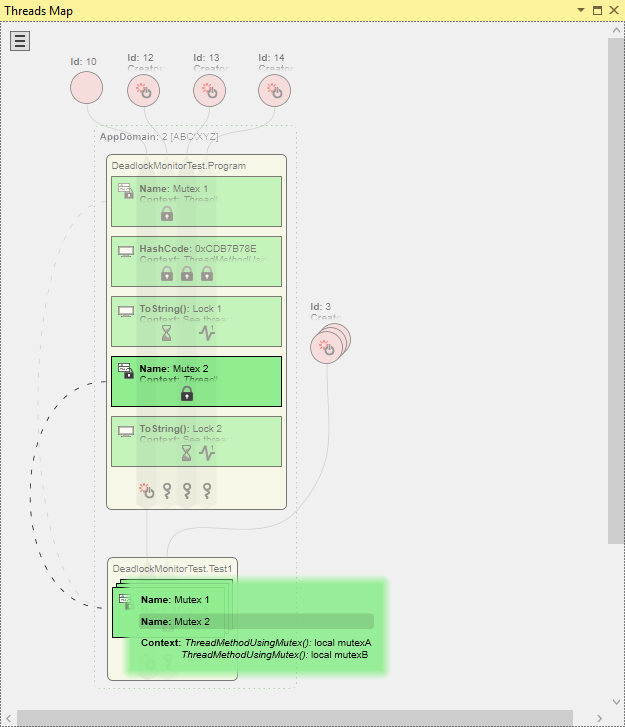
- Clicking on a synchronization primitive connected by a dashed line with its replicas in other classes, highlights all of them to easily see what classes share access to this primitive instance. If several such primitives are part of a stacked rectangle then clicking on the rectangle label opens the list of primitives it contains with the entries for the shared primitives clickable to highlight them. Clicking these elements again toggles the highlighting off. In the below example, the single stacked rectangle in the class at the bottom contains two such shared primitive instances that can be highlighted individually.
- If not all of the threads operating on a given synchronization primitive do so from within the same context then the label in the green rectangle only lists the primitive’s identity but not the context. Clicking individual operation icon in this green rectangle shows the contexts specific to this thread and operation. The third primitive in the first class in the example diagram demonstrates this.

- Threads performing operations on other threads have icons describing what operations were performed. Clicking on such an icon shows a label that list the contexts for the operations. The leftmost thread in both classes in the sample diagram has such icons with labels.
Armed with the above descriptions one can deduce the following about the sample application from the generated diagram. An external thread with Id 10 executes code in DeadlockMonitorTest.Program class’ methods RunTest() and ThreadMethodUsingMonitorPulse(). In RunTest() method it starts three threads with Ids 12, 13 and 14 and waits for them to terminate. All three threads lock and unlock a Monitor object instance with hash code 0xCDB7B78E of type System.Object. Threads with Ids 12 and 13 each lock and unlock their “own” instances of Mutex named “Mutex 1” and “Mutex 2” respectively. They also wait on Monitor objects of type CustomLockObject with ToString() values “Lock 1” and “Lock 2” respectively. These Monitor objects are being pulsed by a thread with Id 14. Then the external thread proceeds to execute RunTest() method of DeadlockMonitorTest.Test1 class where it starts 12 threads and waits for their termination. All 12 threads execute ThreadMethodUsingMutex() method where they lock and unlock the two Mutex instances (“Mutex 1” and “Mutex 2”) which are shared with DeadlockMonitorTest.Program class visited previously.
From the pattern of usage of lock objects “Lock 1” and “Lock 2” you can make an educated guess that thread 14 may be a producer of some sort that notifies threads 12 and 13 using pulse on these objects that the other two threads are waiting for.
The button in the upper left corner of the diagram opens up “Browse For Folder” dialog where a folder with Threads Map files can be selected to generate a diagram from the data collected from one of the previous application executions.
Threads Map feature is supported in Visual Studio 2010 or later as it requires WPF.
Deadlock Detection
The Deadlock Detection feature enhances the functionality of many of the framework’s synchronization primitives by introducing an algorithm that identifies circular wait operations that result in deadlocks. The following synchronization primitives are supported:
MonitorclassEventWaitHandleclassManualResetEventclassAutoResetEventclassMutexclassSemaphoreclassReaderWriterLockclassReaderWriterLockSlimclassWaitHandle.WaitAny(),WaitHandle.WaitAll()andWaitHandle.SignalAndWait()methodsThread.Join()method
The lock keyword of C# language as well as Synclock keyword of VB.NET language are syntactic constructs translated by their respective compilers into code patterns based on Monitor class. Consequently, deadlock detection is applied to these keywords as well. If the algorithm determines that the threads trapped in waiting operations have completed one or more deadlock cycles, a DeadlockException is thrown in one or more of the threads involved in a deadlock cycle. The exception’s message describes the complete wait-for cycles listing all involved threads as well as synchronization primitives acquired and/or waited on by these threads. The following is an example of a deadlock message from a DeadlockException that involves a single deadlock cycle. It was produced by a sample application running multiple threads where each one is entering in an arbitrary order an arbitrary number of nested critical sections protected by Monitor.Enter() and Monitor.Exit() calls. In this example a deadlock between three threads and three monitor objects is described:
Unhandled Exception: Viade.Afterburner.Runtime.Features.DeadlockDetection.DeadlockException: Thread 12(Thread J) encountered the following deadlock condition:

Thread 12(Thread J) entered a cycle by waiting
   at DeadlockMonitorTest.Program.ThreadMethodUsingRandomMonitors() in C:\DeadlockMonitorTest\Program.cs:line 419
   at System.Threading.ThreadHelper.ThreadStart_Context(Object state)
   at System.Threading.ExecutionContext.Run(ExecutionContext executionContext, ContextCallback callback, Object state)
   at System.Threading.ThreadHelper.ThreadStart()
for DeadlockMonitorTest.DeadlockMonitorTest+CustomLockObject=0x1FA0ABC(Lock 3) which was acquired
   at DeadlockMonitorTest.Program.ThreadMethodUsingRandomMonitors() in C:\DeadlockMonitorTest\Program.cs:line 419
   at System.Threading.ThreadHelper.ThreadStart_Context(Object state)
   at System.Threading.ExecutionContext.Run(ExecutionContext executionContext, ContextCallback callback, Object state)
   at System.Threading.ThreadHelper.ThreadStart()
by Thread 11(Thread I) which, in turn, waits
   at DeadlockMonitorTest.Program.ThreadMethodUsingRandomMonitors() in C:\DeadlockMonitorTest\Program.cs:line 419
   at System.Threading.ThreadHelper.ThreadStart_Context(Object state)
   at System.Threading.ExecutionContext.Run(ExecutionContext executionContext, ContextCallback callback, Object state)
   at System.Threading.ThreadHelper.ThreadStart()
for DeadlockMonitorTest.DeadlockMonitorTest+CustomLockObject=0x21128C3(Lock 2) which was acquired
   at DeadlockMonitorTest.Program.ThreadMethodUsingRandomMonitors() in C:\DeadlockMonitorTest\Program.cs:line 419
   at System.Threading.ThreadHelper.ThreadStart_Context(Object state)
   at System.Threading.ExecutionContext.Run(ExecutionContext executionContext, ContextCallback callback, Object state)
   at System.Threading.ThreadHelper.ThreadStart()
by Thread 7(Thread E) which, in turn, waits
   at DeadlockMonitorTest.Program.ThreadMethodUsingRandomMonitors() in C:\DeadlockMonitorTest\Program.cs:line 419
   at System.Threading.ThreadHelper.ThreadStart_Context(Object state)
   at System.Threading.ExecutionContext.Run(ExecutionContext executionContext, ContextCallback callback, Object state)
   at System.Threading.ThreadHelper.ThreadStart()
for DeadlockMonitorTest.DeadlockMonitorTest+CustomLockObject=0x2DF9FA8(Lock 66) which was acquired
   at DeadlockMonitorTest.Program.ThreadMethodUsingRandomMonitors() in C:\DeadlockMonitorTest\Program.cs:line 419
   at System.Threading.ThreadHelper.ThreadStart_Context(Object state)
   at System.Threading.ExecutionContext.Run(ExecutionContext executionContext, ContextCallback callback, Object state)
   at System.Threading.ThreadHelper.ThreadStart()
by Thread 12(Thread J) which completes the cycle.
In the above message a thread is identified by its ManagedThreadId followed in parentheses by its Name if one was assigned. A synchronization object is identified by its type and hash code followed in parentheses by its ToString() representation if one exists. For these thread and object identifiers to be useful in recognizing which players are involved in the deadlock it helps to provide meaningful thread names and synchronization objects’ ToString() implementations. The above deadlock with the call stacks omitted can be summarized as a wait-for cycle
Thread J->Lock 3->Thread I->Lock 2->Thread E->Lock 66->Thread J
where an arrow from a thread to a lock means the thread is waiting for the lock and an arrow from a lock to a thread means the lock was acquired by the thread.
“Capture all thread stacks” setting from “Global” tab of “Afterburner Features…” dialog selects either higher runtime performance of the test application and lower level of details of the DeadlockException reports or lower performance with more details. Normally, the message contains excerpts like “which was acquired at…” followed by the stack trace of the location where a synchronization primitive was acquired by a thread. For this information to appear in the messages, threads must capture stack traces every time they acquire synchronization primitives just in case a deadlock is encountered later. Depending on how often the test application acquires and releases synchronization primitives, it can have a very negative performance effect. When “Capture all thread stacks” is turned off, threads no longer capture thread stack traces at the time they acquire synchronization primitives. Instead, stack traces are captured only after the deadlock was encountered resulting in deadlock exception messages that contain “which was acquired at unknown location”. Unless the performance degradation with “Capture all thread stacks” flag turned on is unacceptable, we recommend keeping this flag on to ensure the most informative deadlock exception messages.
All supported synchronization primitives can be divided into two groups depending on whether they exhibit thread affinity. Monitor objects acquired and released by Enter(), TryEnter() and Exit() methods of Monitor class or Join() method of Thread class as well as Mutex, ReaderWriterLock and ReaderWriterLockSlim objects can only be released by the same thread that acquired them. As a result, deadlock conditions involving exclusively such objects can be pinpointed deterministically resulting in no false negatives or positives. On the other hand, monitor objects used with Wait(), Pulse() and PulseAll() methods of Monitor class as well as EventWaitHandle, ManualResetEvent, AutoResetEvent and Semaphore objects allow any thread to release or signal them. This makes it impossible to discern with certainty whether there is or ever will be a thread in the application that can release or signal such a synchronization primitive when some threads are waiting for it. In other words, false positives are possible when dealing with synchronization primitives that do not have thread affinity. Afterburner uses some heuristics to minimize false outcomes.
Synchronization primitives that do not exhibit thread affinity can introduce possibility of complex deadlocks involving multiple cycles. This is due to the fact that multiple threads can potentially release or signal them. If all threads that have the ability to release/signal such synchronization primitives participate in cycles that lead back to the blocked threads then a multiple cycle deadlock is encountered. DeadlockException thrown in this case describes all the relevant cycles. The only exception is a situation that involves WaitAll() method of WaitHandle class where even one waited-for synchronization primitive involved in a cycle is sufficient to declare a deadlock condition. The following is an example of a deadlock message from a DeadlockException that involves multiple deadlock cycles. It was produced by a sample application running multiple producer and consumer threads where each producer creates N (computed as the number of consumers divided by the number of producers) items and notifies randomly chosen N consumers using each consumers’ individual monitor object. Deadlock is introduced by having each producer attempt to wait on a Mutex owned by a random consumer. Eventually, all producers block creating a deadlock. In this example, four consumers and two producers create a deadlock with three cycles. All call stacks are edited out for brevity:
Unhandled Exception: Viade.Afterburner.Runtime.Features.DeadlockDetection.DeadlockException: Thread 5(Producer0) encountered the following deadlock condition:

Thread 3(Producer1) entered a cycle by waiting
   at …
for System.Threading.Mutex=0xBF7771 which was acquired
   at …
by Thread 7(Consumer0) which, in turn, waits
   at …
for DeadlockMonitorTest.DeadlockMonitorTest+CustomLockObject=0xAE65B0(Lock 1) which can be pulsed
   at …
by Thread 5(Producer0) which, in turn, waits
   at …
for System.Threading.Mutex=0x5C39D4 which was acquired
   at …
by Thread 4(Consumer3) which, in turn, waits
   at …
for DeadlockMonitorTest.DeadlockMonitorTest+CustomLockObject=0x3DD3515(Lock 4) which can be pulsed
   at …
by Thread 5(Producer0) which completes the cycle.

Thread 3(Producer1) entered a cycle by waiting
   at …
for System.Threading.Mutex=0xBF7771 which was acquired
   at …
by Thread 7(Consumer0) which, in turn, waits
   at …
for DeadlockMonitorTest.DeadlockMonitorTest+CustomLockObject=0xAE65B0(Lock 1) which can be pulsed
   at …
by Thread 5(Producer0) which, in turn, waits
   at …
for System.Threading.Mutex=0x5C39D4 which was acquired
   at …
by Thread 4(Consumer3) which, in turn, waits
   at …
for DeadlockMonitorTest.DeadlockMonitorTest+CustomLockObject=0x3DD3515(Lock 4) which can be pulsed
   at …
by Thread 3(Producer1) which completes the cycle.

Thread 3(Producer1) entered a cycle by waiting
   at …
for System.Threading.Mutex=0xBF7771 which was acquired
   at …
by Thread 7(Consumer0) which, in turn, waits
   at …
for DeadlockMonitorTest.DeadlockMonitorTest+CustomLockObject=0xAE65B0(Lock 1) which can be pulsed
   at …
by Thread 3(Producer1) which completes the cycle.
Producer0 is waiting for the Mutex owned by Consumer3 and Producer1 is waiting for the Mutex owned by Consumer0. All consumers wait for any of the producers to create an item but all of the producers are blocked. The above deadlock can be summarized as the following set of wait-for cycles (omitting the monitor and Mutex objects):
Producer1->Consumer0->Producer0->Consumer3->Producer0
Producer1->Consumer0->Producer0->Consumer3->Producer1
Producer1->Consumer0->Producer1
Synchronization primitives that do not have thread affinity can introduce yet another kind of deadlock condition that cannot be described by wait-for cycles alone. Such a condition can arise when one or more threads are waiting for a primitive with no thread affinity and each known thread capable of releasing or signaling this primitive is either involved in a wait-for cycle or has terminated. In the degenerate case, all the known threads capable of releasing or signaling the primitive have terminated. In such a case the deadlock is reported without any cycles and only listing all the terminated threads known to have released or signaled the primitive in question. Here is an example of a deadlock message from a DeadlockException that involves terminated threads. It was produced by a sample application running multiple producer and consumer threads where each producer creates a fixed number of items and notifies all consumers by calling Monitor.PulseAll() on a common monitor object. Each consumer thread waits for the common monitor object and consumes one item upon being pulsed. Deadlock is introduced by having all producers terminate prematurely. In this example, four consumers and two producers create a deadlock with no cycles:
Unhandled Exception: Viade.Afterburner.Runtime.Features.DeadlockDetection.DeadlockException: Thread 7(Consumer0) encountered the following deadlock condition:

The following threads are waiting for System.Object=0x3CE0BB8:

Thread 6(Consumer1)
   at DeadlockMonitorTest.Program.ThreadMethodUsingMonitorPulseAll() in C:\DeadlockMonitorTest\Program.cs:line 548
   at System.Threading.ThreadHelper.ThreadStart_Context(Object state)
   at System.Threading.ExecutionContext.Run(ExecutionContext executionContext, ContextCallback callback, Object state)
   at System.Threading.ThreadHelper.ThreadStart()
Thread 5(Consumer3)
   at DeadlockMonitorTest.Program.ThreadMethodUsingMonitorPulseAll() in C:\DeadlockMonitorTest\Program.cs:line 548
   at System.Threading.ThreadHelper.ThreadStart_Context(Object state)
   at System.Threading.ExecutionContext.Run(ExecutionContext executionContext, ContextCallback callback, Object state)
   at System.Threading.ThreadHelper.ThreadStart()
Thread 4(Consumer2)
   at DeadlockMonitorTest.Program.ThreadMethodUsingMonitorPulseAll() in C:\DeadlockMonitorTest\Program.cs:line 548
   at System.Threading.ThreadHelper.ThreadStart_Context(Object state)
   at System.Threading.ExecutionContext.Run(ExecutionContext executionContext, ContextCallback callback, Object state)
   at System.Threading.ThreadHelper.ThreadStart()
Thread 7(Consumer0)
   at DeadlockMonitorTest.Program.ThreadMethodUsingMonitorPulseAll() in C:\DeadlockMonitorTest\Program.cs:line 548
   at System.Threading.ThreadHelper.ThreadStart_Context(Object state)
   at System.Threading.ExecutionContext.Run(ExecutionContext executionContext, ContextCallback callback, Object state)
   at System.Threading.ThreadHelper.ThreadStart()

However, there are no alive non-blocked threads left that were ever observed to manipulate this synchronization primitive.
The following threads that were observed to manipulate it are no longer alive:

    Thread 8(Producer1)
    Thread 3(Producer0)
Additional processing carried out by the deadlock detection algorithm implies that some performance degradation of the processed application is to be expected. However, for a typical application that spends most of its time performing useful work rather than acquiring/releasing synchronization primitives, the performance penalty should be reasonable. “Capture all thread stacks” setting described above can for the most part solve the performance issues. In the worst case scenario, as an alternative to applying this feature on a regular basis due to performance issues, you might consider using it only when a necessity arises – such as when you know your application is experiencing a deadlock that can be reproduced.
Deadlock Prediction
The Deadlock Prediction feature applies to the same set of synchronization primitives as Deadlock Detection. It performs acquisition patterns analysis. Fairly often a multithreaded application is required to manipulate in atomic fashion several data structures protected by different synchronization primitives. The thread performing such a complex operation must have an exclusive access to all of the involved data structures at once to ensure atomicity of the operation. This implies that the thread must acquire all of the involved synchronization primitives before it can proceed. Lock leveling algorithm is one of the most commonly used techniques to prevent deadlocks from happening between threads performing such complex operations. It dictates that each thread must acquire the necessary synchronization primitives only in a designated order. Here is an article covering this topic in details: Use Lock Hierarchies to Avoid Deadlock by Herb Sutter.
The more complex an application is, the more discipline is required from developers to properly adhere to the lock leveling strategy. Deadlock Prediction feature is designed to assist in identifying the strategy violations by monitoring what synchronization primitives and in what order are acquired by each thread. It reports all instances of acquisitions done by different threads in a conflicting order. Such an ordering violation is a strong indicator that a potential for a deadlock exists in the application and it’s just a matter of time before the application encounters a particular timing sequence that actually leads to a deadlock state. This report is being generated after the test application cleanly completes its execution. It contains the description of each thread that acquired some synchronization primitives, the particular sequence of acquisitions for each of the involved threads and the stacks showing where each synchronization primitive was acquired. Please see the Reports section below for the detailed description of possible reports.
It’s not necessary to apply Deadlock Prediction feature to a project on a regular basis. In fact, additional actions that need to be performed during the application execution can slow the application down considerably. There is also a report generation step that follows the termination of the application that, depending on the complexity of the application, could take a non-trivial amount of time. Due to this overhead the feature is intended to be employed periodically to check that the latest code modifications did not introduce new lock leveling violations. In this respect, the feature is somewhat comparable to a performance analysis done by a profiling tool – an occasional analysis that only needs to be performed at key moments of the development cycle.
Dispose Monitoring
Even though .NET offers garbage collection (GC) as one of its key facilities, the nondeterministic nature of the GC algorithms makes it less than perfect for controlling life times of objects managing critical resources that need to be released in a timely manner. For such situations .NET incudes IDisposable interface. Implementing this interface allows a class to “advertise” to its clients the fact that its instances control critical resources and therefore clients are encouraged to call the Dispose() method as soon as these instances are no longer needed so that they can release their resources long before they can be garbage collected. Unfortunately, there is no facility that enforces this pattern – if a developer using such a class fails to call the Dispose() method in a timely manner, the critical resources can stay tied up for an indefinite period of time. You can find a very detailed discussion of this and related topics in DG Update: Dispose, Finalization, and Resource Management article by Joe Duffy.
Dispose Monitoring feature is designed to report on all instances of classes implementing IDisposable interface whose Dispose() method was not called before the instance was garbage collected. Similar to the Deadlock Prediction feature’s report, un-disposed objects are being reported after the test application cleanly completes its execution. It contains the object’s description and the stack showing where the object was allocated. Please see the Reports section below for the details.
Reports
While a test application is executing, Threads Map, Deadlock Prediction and Dispose Monitoring features perform their respective run-time analyses of relevant application operations while accumulating some raw data for the reports to be generated after application has exited. The collected data is initially stored in memory and is serialized to files upon application termination. The files can be found in Afterburner subdirectory created under the directory where the executable of your test application resides. After application’s completion, the raw data files are being processed and textual reports or a diagram are generated. The duration of the processing step depends on the number of threads in the application and the number of synchronization primitives’ acquisitions performed. A progress bar may be displayed while the data is being processed if the processing turns out to be lengthy enough. For Deadlock Prediction and Dispose Monitoring, the data processing step generates report text files placed into the Afterburner subdirectory mentioned above and the raw data used to generate these reports is deleted. Once report text files are created, they are opened in Visual Studio for your examination. If the application was not executed from within Visual Studio debugger then the reports are opened in the default text editor application. The naming of the report files follows this pattern: <Feature_Name>_<date>_<time>.txt. Each execution of the test application generates one report file per enabled feature. For Threads Map feature the data processing step generates data files placed into subdirectory named Threads_Map_<date>_<time> and these files are not deleted so you can generate a diagram for the stored set of data files at any time later.
As stated above, the Afterburner features are based on dynamic analysis of the running application. The likelihood of discovering bugs using any of the features is dependent on the code coverage of the particular tests executed while the features are enabled. Basically, a choice of test scenarios largely determines the effectiveness of testing and the quality of the produced reports.
The following is an example of a Deadlock Prediction feature report:
------ Afterburner Deadlock Prediction feature report for AppDomain=1[DeadlockMonitorTest.vshost.exe] start ------
Thread 11(Thread A) and Thread 12(Thread B) entered critical sections controlled by
    DeadlockMonitorTest.DeadlockMonitorTest+CustomLockObject=0xBB8560(Lock 88) and
    DeadlockMonitorTest.DeadlockMonitorTest+CustomLockObject=0x165F26B(Lock 69)
in a conflicting order.

Thread 11(Thread A) entered the critical sections in the following order:
    DeadlockMonitorTest.DeadlockMonitorTest+CustomLockObject=0x1E6FA8E(Lock 45) ->
    DeadlockMonitorTest.DeadlockMonitorTest+CustomLockObject=0x19FD5C7(Lock 46) ->
    DeadlockMonitorTest.DeadlockMonitorTest+CustomLockObject=0x2BF8098(Lock 22) ->
    DeadlockMonitorTest.DeadlockMonitorTest+CustomLockObject=0x2804C64(Lock 44) ->
    DeadlockMonitorTest.DeadlockMonitorTest+CustomLockObject=0x165F26B(Lock 69) ->
    DeadlockMonitorTest.DeadlockMonitorTest+CustomLockObject=0xBB8560(Lock 88)

Stack(s) at entering into critical section controlled by DeadlockMonitorTest.DeadlockMonitorTest+CustomLockObject=0xBB8560(Lock 88):
   at DeadlockMonitorTest.Program.ThreadMethodUsingRandomMonitors() in C:\DeadlockMonitorTest\Program.cs:line 418
   at System.Threading.ThreadHelper.ThreadStart_Context(Object state)
   at System.Threading.ExecutionContext.Run(ExecutionContext executionContext, ContextCallback callback, Object state)
   at System.Threading.ThreadHelper.ThreadStart()

Stack(s) at entering into critical section controlled by DeadlockMonitorTest.DeadlockMonitorTest+CustomLockObject=0x165F26B(Lock 69):
   at DeadlockMonitorTest.Program.ThreadMethodUsingRandomMonitors() in C:\DeadlockMonitorTest\Program.cs:line 418
   at System.Threading.ThreadHelper.ThreadStart_Context(Object state)
   at System.Threading.ExecutionContext.Run(ExecutionContext executionContext, ContextCallback callback, Object state)
   at System.Threading.ThreadHelper.ThreadStart()

Thread 12(Thread B) entered the critical sections in the following order:
    DeadlockMonitorTest.DeadlockMonitorTest+CustomLockObject=0xBB8560(Lock 88) ->
    DeadlockMonitorTest.DeadlockMonitorTest+CustomLockObject=0x165F26B(Lock 69) ->
    DeadlockMonitorTest.DeadlockMonitorTest+CustomLockObject=0x3E799B(Lock 62)

Stack(s) at entering into critical section controlled by DeadlockMonitorTest.DeadlockMonitorTest+CustomLockObject=0xBB8560(Lock 88):
   at DeadlockMonitorTest.Program.ThreadMethodUsingRandomMonitors() in C:\DeadlockMonitorTest\Program.cs:line 418
   at System.Threading.ThreadHelper.ThreadStart_Context(Object state)
   at System.Threading.ExecutionContext.Run(ExecutionContext executionContext, ContextCallback callback, Object state)
   at System.Threading.ThreadHelper.ThreadStart()

Stack(s) at entering into critical section controlled by DeadlockMonitorTest.DeadlockMonitorTest+CustomLockObject=0x165F26B(Lock 69):
   at DeadlockMonitorTest.Program.ThreadMethodUsingRandomMonitors() in C:\DeadlockMonitorTest\Program.cs:line 418
   at System.Threading.ThreadHelper.ThreadStart_Context(Object state)
   at System.Threading.ExecutionContext.Run(ExecutionContext executionContext, ContextCallback callback, Object state)
   at System.Threading.ThreadHelper.ThreadStart()

------ Afterburner Deadlock Prediction feature report for AppDomain=1[DeadlockMonitorTest.vshost.exe] end ------
The report is divided into sections – one per application domain (AppDomain) encountered in the test application. Each conflicting synchronization primitive acquisition occurrence is described by stating which threads acquired primitives in conflicting order, what was the order of acquisition for each thread and the call stacks recorded when acquisitions took place in each of the sequences.
Here is an example of a Dispose Monitoring feature report:
------ Afterburner Dispose Monitoring feature report for AppDomain=1[DisposeMonitorTest.vshost.exe] start ------

Encountered undisposed DisposeMonitorTest.BaseGenericClass`2[System.Int32,System.String]=0x2B6A1CA constructed by Thread 10 at:
   at DisposeMonitorTest.DisposeMonitorTest.DoStuff() in C:\DisposeMonitorTest\DisposeMonitorTest.cs:line 25
   at DisposeMonitorTest.DisposeMonitorTest.Main(String[] args) in C:\DisposeMonitorTest\DisposeMonitorTest.cs:line 12
   at System.AppDomain._nExecuteAssembly(Assembly assembly, String[] args)
   at System.AppDomain.ExecuteAssembly(String assemblyFile, Evidence assemblySecurity, String[] args)
   at Microsoft.VisualStudio.HostingProcess.HostProc.RunUsersAssembly()
   at System.Threading.ThreadHelper.ThreadStart_Context(Object state)
   at System.Threading.ExecutionContext.Run(ExecutionContext executionContext, ContextCallback callback, Object state)
   at System.Threading.ThreadHelper.ThreadStart()

Encountered undisposed DisposeMonitorTest.DisposableClass=0x2B89EAA constructed by Thread 10 at:
   at DisposeMonitorTest.DisposeMonitorTest.DoStuff() in C:\DisposeMonitorTest\DisposeMonitorTest.cs:line 19
   at DisposeMonitorTest.DisposeMonitorTest.Main(String[] args) in C:\DisposeMonitorTest\DisposeMonitorTest.cs:line 12
   at System.AppDomain._nExecuteAssembly(Assembly assembly, String[] args)
   at System.AppDomain.ExecuteAssembly(String assemblyFile, Evidence assemblySecurity, String[] args)
   at Microsoft.VisualStudio.HostingProcess.HostProc.RunUsersAssembly()
   at System.Threading.ThreadHelper.ThreadStart_Context(Object state)
   at System.Threading.ExecutionContext.Run(ExecutionContext executionContext, ContextCallback callback, Object state)
   at System.Threading.ThreadHelper.ThreadStart()

------ Afterburner Dispose Monitoring feature report for AppDomain=1[DisposeMonitorTest.vshost.exe] end ------
This report is also divided into sections for each AppDomain encountered in the test application. Each instance of an object implementing IDisposable whose Dispose() method was not called before it was garbage collected is described by stating the object’s type, hash code and the call stack at the place of object allocation. Many applications intentionally do not dispose of disposable objects if their lifetime is supposed to match that of the application itself. For this reason, to avoid reporting false positives, only garbage collections performed prior to the initiation of the application shut-down sequence trigger reporting of un-disposed objects.
Errors
There are some error conditions that can be reported either during the compilation post-processing step or during application test execution run. Here is the list of errors pertaining to the post-processing step that are reported in the build output window of Visual Studio:
- Possible error in nesting of Monitor Enter/Exit calls.
Most likely reason for this error is presence of a method with an unbalanced nesting ofMonitor.Enter()andMonitor.Exit()calls. The structure of your code is not necessarily erroneous but rather it does not follow the “standard” locking patterns and is something that might need more thorough examination to make sure that it does represent your intended lock acquisition/release logic. - Possible error in matching lock objects for Monitor Enter/Exit calls.
A method was encountered that seems to follow the standard locking patterns but different variables were used to enter and exit a particular critical section. Again, this does not necessarily imply an error but rather a situation that might require further scrutiny. - Various Internal failures.
An internal failure of Afterburner itself – most likely a bug. In such a case, Afterburner’s compile-time log file is updated with the details of the failure. The log file is named Aferburner.log and is located in Log subdirectory of Afterburner installation directory. Some errors might generate additional log files with further error details. These files are also deposited into Log subdirectory. In case you do encounter such an internal error we ask that you, please, report it as per our Contact Us page. Please, describe the circumstances of the error in as much detail as possible and attach all the log files found in Log subdirectory.
The following are Afterburner errors that can be reported during the runtime of the test application:
- “<synchronization primitive id> is being cleared of owner <thread id> but it is not owned by any thread”
A thread attempted to release a synchronization primitive that was not acquired before by this or by any other thread. - “<synchronization primitive id> is being cleared of owner <thread id 1> which does not match current owner <thread id 2>”
A thread attempted to release a synchronization primitive with thread affinity which is currently owned by a different thread. - “<ReaderWriterLock id> is being cleared of owner <thread id> but it is not owned by any thread”
A thread attempted to release the Reader Lock of aReaderWriterLockthat currently does not have any threads owning its Reader Lock. - “<ReaderWriterLock> is being cleared of owner <thread id> which is not one of the owner threads”
A thread attempted to release the Reader Lock of aReaderWriterLockthat currently has threads owning its Reader Lock but the attempting thread is not one of the owners. - Various internal runtime failures.
An internal failure of Afterburner runtime environment – in all likelihood an Afterburner bug. An error message is displayed on the application’s console if one is available or through a message box. A detailed description of the error is also logged into the Afterburner runtime log. The runtime log is stored in Afterburner subdirectory created under the directory where the executable for your test application resides. This is the same directory that is used by Threads Map, Deadlock Prediction and Dispose Monitor features for their reports as described above. The log file is named Runtime.log. Yet again, in case you do encounter a runtime error we ask that you, please, report it as per our Contact Us page. Please, describe the circumstances of the error in as much detail as possible and attach the Runtime.log file.
Current Limitations
- If an older version of Afterburner is already installed on the computer it must be uninstalled first before a later version is installed.
- Deadlock Detection and Deadlock Prediction features only operate within the boundaries of each individual application domain. Therefore, these features do not work with lock objects that can span multiple domains and are used to synchronize threads between these domains. Objects that fall into this category are internalized
Stringobjects,Typeobjects, etc. - If an
EventWaitHandle,AutoResetEvent,ManualResetEventorSemaphoreinstance was constructed in an assembly for which Deadlock Detection feature was not enabled then, even if this synchronization primitive is used in another assembly for which Deadlock Detection feature was enabled, this primitive is ignored by Afterburner since it does not have complete access to its full lifetime. - In order for Threads Map, Deadlock Prediction and Dispose Monitoring features to generate their reports, the test application must exit in an orderly fashion rather than be killed or abruptly terminate due to an unhandled exception.
- Multi-module assemblies are not supported.
- Xamarin based projects (Android, iOS, etc.)
- Edit-and-continue Visual Studio feature is not supported.
- Enabling any of the features introduces dependencies on Viade.Afterburner.Common.dll and Viade.Afterburner.Runtime.dll assemblies for your test application. Either Afterburner must be installed on the test machine or these assemblies must be registered in GAC manually.
- Any computer on which you intend to run a test application with Threads Map, Deadlock Prediction and/or Dispose Monitor features enabled must have Afterburner installed in order for the generated raw report data to be post-processed and the text reports to be generated.
- Let’s say you have a test application for which Dispose Monitoring feature is enabled and it has a base class implementing
IDisposableinterface and a deriving class that overridesToString()Afterburner callsToString()from within the constructor of the base class to assemble a string that describes the object for a report. TheToString()version of the derived class is called since derived class overrides this method. The derived class’ constructor has not been executed yet at that time – the base constructor is still executing. If overriddenToString()refers to a member of the derived class that has not been initialized yet because it is initialized in the constructor of the derived class, the method can throw an exception. This exception is anticipated and Afterburner normally conceals it. However, if Enable Just My Code Visual Studio debugger option is turned on, the debugger can break on such exception before Afterburner gets a chance to handle it since it is being caught in non-user (i.e. Afterburner injected) code. You can either ignore the break and continue to debug or turn off Enable Just My Code option or place an explicittry/catchin theToString()method of the derived class. - Multiple threads involved in a deadlock situation can throw
DeadlockExceptiondescribing the same wait-for cycle in which all the threads that threw the exception participate. Depending on your particular situation, this may or may not be a bad thing. - Dispose Monitoring feature introduces the necessary tracking code into each class that explicitly implements
IDisposableUn-disposed instances of classes with derivation chains that include multiple base classes that explicitly implementIDisposableinterface get reported more than once. - Deadlock Detection feature can produce false positives or false negatives when dealing with synchronization primitives that do not have thread affinity. Synchronization primitives like monitor objects used with
Wait(),Pulse()andPulseAll()methods ofMonitorclass as well asEventWaitHandle,ManualResetEvent,AutoResetEventandSemaphoreobjects allow any thread to release or signal them. This makes it impossible to discern with certainty whether there is or ever will be a thread in the application that can release or signal such a synchronization primitive when some threads are waiting for it. Afterburner uses various heuristics to minimize the possibility of false outcomes. - Deadlock Prediction report can contain multiple occurrences of the same two threads acquiring the same two locks in conflicting orders. For example, thread A could have acquired lock #1 followed by #2 followed by #3 then released lock #3 and acquired lock #4 while thread B could have acquired lock #2 followed by #1. There could have been these two distinct moments in time
- thread A owns locks #1, #2 and #3; thread B owns locks #2 and #1
- thread A owns locks #1, #2 and #4; thread B owns locks #2 and #1
when locks #1 and #2 were held by different threads and were acquired in conflicting orders. A report is generated for each of these occurrences even though on practice they are the same issue.
Uninstall
Even though we hope you will not need to use this functionality, uninstalling the tool can be done through the “Add or Remove Programs” or “Uninstall a program” utilities in the Control Panel by choosing “Afterburner” entry. All the installation files and registry keys are removed. However, Afterburner settings in the projects that were ever compiled with afterburner will remain in their corresponding project files.

